See also
This page was generated from examples/example02.ipynb.
Download the Jupyter Notebook for this section: example02.ipynb. View in nbviewer.
Drosophila Circadian Clock
[1]:
%matplotlib inline
from ecell4.prelude import *
This is a model of the oscillating Drosophila period protein (PER). This model is based on the model introduced in the following publication:
[2]:
citation(8587874)
Goldbeter A, A model for circadian oscillations in the Drosophila period protein (PER). Proceedings. Biological sciences, 1362(261), 319-24, 1995. 10.1098/rspb.1995.0153. PubMed PMID: 8587874.
[3]:
with reaction_rules():
    ~M > M | 0.76 / (1 + Pn ** 3)
    M > ~M | 0.65 * M / (0.5 + M)
    ~P0 > P0 | 0.38 * M
    P0 == P1 | (3.2 * P0 / (2 + P0), 1.58 * P1 / (2 + P1))
    P1 == P2 | (5 * P1 / (2 + P1), 2.5 * P2 / (2 + P2))
    P2 == Pn | (1.9, 1.3)
    P2 > ~P2 | 0.95 * P2 / (0.2 + P2)

m = get_model()
[4]:
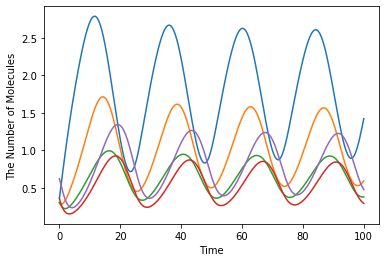
y0 = {"M": 3.61328202e-01, "Pn": 6.21367e-01, "P0": 3.01106835e-01, "P1": 3.01106835e-01, "P2": 3.61328202e-01}
ret = run_simulation(100, ndiv=400, model=m, y0=y0)
[5]:
ret

[6]:
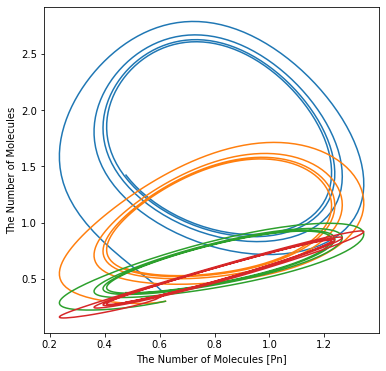
ret.plot(x="Pn", y=["M", "P0", "P1", "P2"], figsize=[6.0, 6.0])
